Node Charts: Info Graphs For Blender Using Geometry Nodes
Create stunning charts and presentations with ease using our collection of pre-designed Info graphs for Blender.
CSV support
MySQL Database support
Dynamic Graphs
Frame Rate changer
Aspect Ratio changer
Bar Graph Highlighting
Bulk Font Changer
Animation Duration Control for all Graphs
Graphs are available to use in Asset Browser
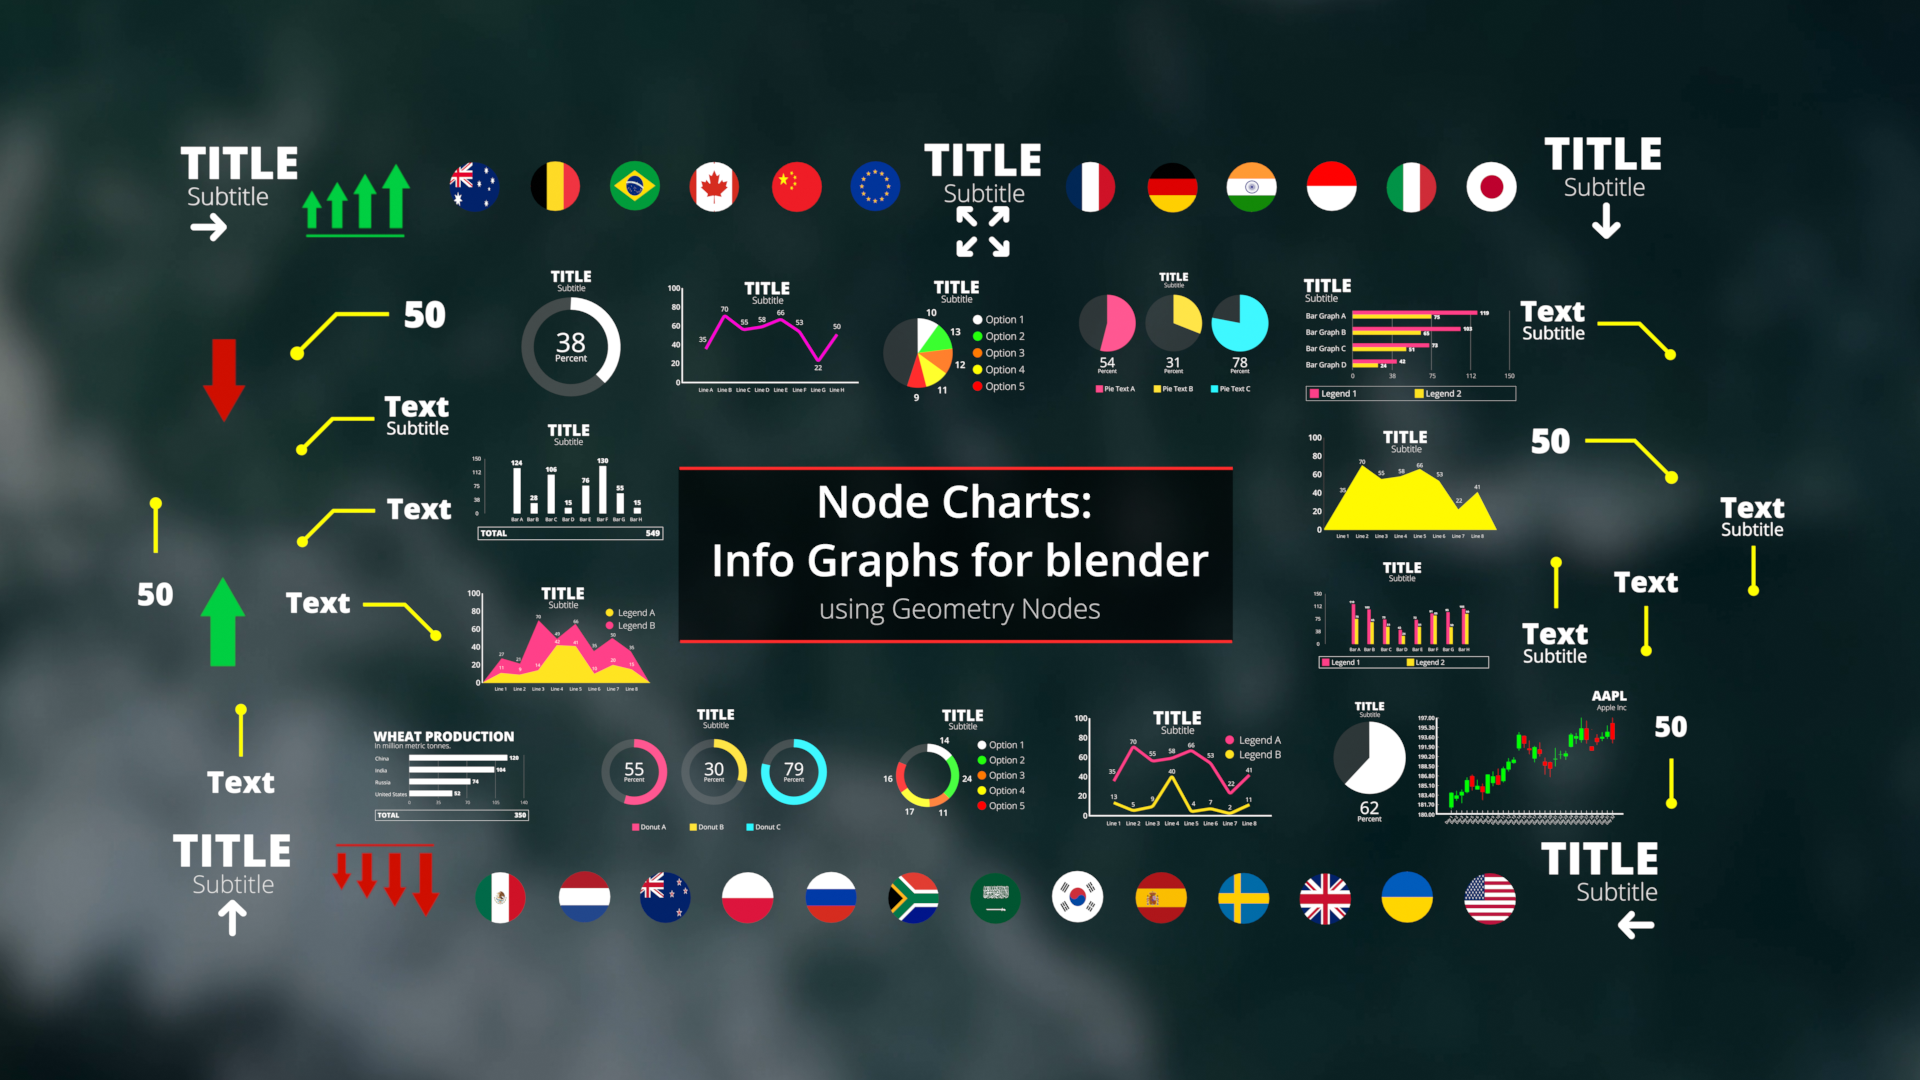
24 Graphs: (Bubble Graph, Scatter Graph, Circle Graph, 2-3 Circle Graph, Candlestick Graph, 2-3 Pie Graph, Horizontal Bar Graph, Horizontal Bar Graph comparison, Horizontal Bar Graph Stacked, Horizontal Bar Graph Opposing, Pie Graph, Multiple Circle Graph, Multiple Pie Graph, Line Graph, Line Graph comparison, Mountain Graph, Mountain Graph Comparison, Radar Graph, US Data Viz Map, Vertical Bar Graph, Profit Loss Bar Graph, Vertical Bar Graph comparison, Vertical Bar Graph Stacked, Vertical Bar Graph Multiple)
Five 3D Cycles Graphs: (Circle Graph, 2-3 Circle Graph, 2-3 Pie Graph, Pie Graph, Horizontal Bar Graph)
Experimental GenAI support for 10 Graphs (API Charges separate)
Python add-on automation
Custom Animations for each Graph
No need of Keyframes (Just change numbers)
12 Simple Customizable Callouts
5 Professional Title Animations
25 Dynamic Flag animations
4 Icon Animations
Support for Brand Colors
For Cycles and Eevee
For Personal and Commercial use
All Future updates are FREE
Made in Geometry nodes
Customizable
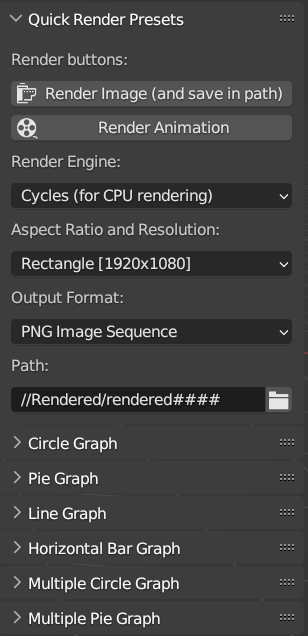
One Click Output settings
Detailed PDF Manual and Video Training Tutorials available
1080p and 4K support
3 Free Background videos for Graphs
What are Info Graphs?
Info Graphs are pre-designed and customizable graphs that provide an easy way to present complex data and information in a visually appealing and understandable way.
With Info Graphs for Blender, you can easily add data charts to your projects, saving you time and effort instead of designing from scratch.
(Below is the original trailer, Click the Video Demo button at the top for the Latest Update Trailer)
Backstory behind this product
The Geometry Nodes update in Blender allows users to create procedural models, which means that the models can be generated automatically based on certain rules and parameters.
This is a game-changer for creating info graphs, as it allows for the creation of complex shapes and animations with just some nodes.
Blender is now a serious contender for creating info charts that were previously only possible with other software such as After Effects.
Whether you are a 3D artist or a data scientist, the possibilities for creating engaging and informative infographics with Blender are now greater than ever before.
24 Geometry nodes powered Charts:
-
Bubble Graph, Scatter Graph, Circle Graph, 2-3 Circle Graph, Candlestick Graph, 2-3 Pie Graph, Horizontal Bar Graph, Horizontal Bar Graph comparison, Horizontal Bar Graph Stacked, Horizontal Bar Graph Opposing, Pie Graph, Multiple Circle Graph, Multiple Pie Graph, Line Graph, Line Graph comparison, Mountain Graph, Mountain Graph Comparison, Radar Graph, US Data Viz Map, Vertical Bar Graph, Profit Loss Bar Graph, Vertical Bar Graph comparison, Vertical Bar Graph Stacked, Vertical Bar Graph Multiple

Five 3D Cycles Graphs:
Five Graphs are added to the product: (Circle Graph 3D, 2-3 Circle Graph 3D, Pie Graph 3D, 2-3 Pie Graph 3D, Horizontal Bar Graph 3D)The Python add-on for the 2D Graphs also work for the 3D Graphs as well. These Graphs currently only work with the Cycles Render Engine.
.csv support:
You can use a csv file (comma separated value) to fill data inside the charts. You don't have to manually input data if you don't want.You can open those files in any spreadsheet software (like Microsoft Excel, Google Sheets, LibreOffice Calc, Gnumeric etc.) and fill the table.
Once you fill and save the csv file. You can load them in blender by clicking Import csv. All the data will be taken from the csv file and will be imported in blender
;
MySQL database support:
You can use a MySQL database to fill data inside the charts. You don't have to manually input data if you don't want. You can open those files in any MySQL editors and fill the table. Once you run the SQL script and create the database.You can load them in blender by clicking Import MySQL. All the data will be taken from the database and will be imported in blender.
1080p and 4K support (Square, vertical, and Horizontal Aspect Ratio supported):
The background videos along with the graphs supports these following resolutions.
You can make graphs for TikTok, YouTube or in square aspect ratio which works on almost all sites.
Dynamic Graphs:
Dynamic Graphs (as opposed to Static graphs) changes based on the maximum and minimum parameters.
For example, in the line graph, the Y axis goes from 0 to 100 and all the points are based on the minimum and maximum values. If I changed the maximum values to 200, then all the points readjust based on the new parameters.
Bulk Font changer:
The Python addon allows you to change the fonts of multiple texts at once.
Just click on the folder icon to select the font and Apply All Fonts to apply it. There is another option called “Restore OpenSans” which restores all texts to the default font setting.
Frame Rate changer:
Changing the frame rate here will change the keyframe locations as well using python. (as opposed to changing it in the Blender Output Properties tab)
One second = 24 frames in 24FPS and 30 frames in 30FPS
Animation Duration Control for all Graphs:
You can now change the time when the animation starts and the length of each keyframe animation with a slider. This gives a control of the Graph animation not seen in any other product till date.
Multiple Graphs per scene:
You can now create a dashboard filled with Graphs, Titles, and Callouts. (Check out the dashboard scene in the file) The Python code is revamped to support individual assets. You can now:Import CSV individually by active object
Import MySQL individually by active object
Control Duration individually by active object
Change Fonts individually by active object;
Custom Animations for each Graph:
I have used the Duration control to set Unique animations for each graph, as shown in the trailer and the sample video.
Aspect Ratio changer:
This setting scales and repositions the entire Graph based on the Aspect Ratio applied. You can always use the settings inside the Geometry nodes modifier to move or scale it further.
No need of Keyframes (Just change numbers):
The usual method of animating is that you have to set keyframes to the values and then manually set the animation curves for the desired result.
I use geometry nodes to keyframe and fine-tune the animation curves of a math node, then I connected it to the regular values.
So now, you can just set the values and the animation will adjust according to the values.
Bar Graph Highlighting:
You can now highlight specific bars to make them stand out in the scene.
You can manually highlight any bar you want. You can highlight the highest value of all the bars and highlight the lowest value of all the bars.
Experimental GenAI Support for 10 Graphs: (API Charges separate)
Support for Circle Graph, Pie Graph, 2-3 Circle Graph, 2-3 Pie Graph, Multiple Circle Graph, Multiple Pie Graph, Horizontal Bar Graph, Multiple Bar Graph, Line Graph, Mountain Graph.You can send a prompt to an LLM and have it return data for the Graphs with source. It is not perfect but its a great way to add data in graphs that helps save Time and effort.
12 Simple Customizable Callouts:
Powered by Geometry nodes. Saved in Asset Browser. You can define certain data points in the graph with a callout, available in all 4 directions (animated with pointed up, down, left and right).
5 Professional Title Animations:
Powered by Geometry nodes. Saved in Asset Browser. You can now disable the inbuilt title and add the animated titles in the scene using the asset browser.
25 Dynamic Flag animations:
You can now use Animated circle flags to define bar charts and other graphs. Just drag and drop the flags on the bars. as you would do with any other asset.
Support for Brand Colors:
There is now an option under each graph called background switch which you can use to enable a solid color background. You can now use that to set colors to match your organization or brand.
4 Icon Animations:
Powered by Geometry nodes. Saved in Asset Browser. These are primarily arrows used to show Profit and loss. (Pointed up and down) Just drag them from the asset browser and drop them in your scene.For Cycles and Eevee:
This product supports two render engines, Cycles and Eevee.
If you have an NVIDIA GPU, you can use Eevee. If you have a CPU or a slower GPU, you can use Cycles.
Render times for both are probably the same, since the Graphs have fewer polygons and simple shaders. It is just a matter of preference.
Made in Geometry Nodes:
This product was made using Geometry Nodes for the Graphs and python for automation of certain tasks.
Here’s a quick introduction if you don’t know what that is
https://docs.blender.org/manual/en/latest/modeling/geometry_nodes/introduction.html
Limitless customization:
The customization of the graphs concerns with each element of the graph.
For example, you can change Title, Subtitle, Graph size, Move it on X and Y axis.
Move only the title and subtitle block, make the circle graph thinner, disable background image, and so much stuff about other graphs that it will take an entire page to describe it.
One Click Output settings:
You can set all the render settings of image or video format just in one click.
Otherwise, if you click PNG in the output tab, you manually have to Color format, color depth, compression, and image sequence settings. The same kind of complexity goes for OpenEXR and MP4 formats.
If you click it through the renaissance add-on, all those settings are automatically adjusted for you.
For Personal and Commercial use:
You can use this product to earn money from it through freelancing and so on.
"Pro - Single Seat": Full Product. Single Seat. License For Freelancers or Individuals, for both personal and commercial use.
"Pro - Multi Seat": Full Product. Unlimited Seats within 1 company. License For Studios and Companies, for both personal and commercial use.
(If you have bought this product before 23th December 2023, you have been grandfathered in for a Multi-Seat License regardless of what you paid.)
The Blend file, Poster, trailer, samples, Video and PDF Training tutorial are Standard Royalty Free license.
More info here: https://support.blendermarket.com/article/49-standard-royalty-free-license
The Python Renaissance Add-on is licensed GPL 3.0. https://www.gnu.org/licenses/gpl-3.0.html
You can use it to earn money but if you build upon the add-on with your own code, the code has to be licensed under GPL 3.0 as well.
Read their respective license in their folder for the complete information on distribution.
Extensive PDF Documentation:
Do you just want to learn a small aspect of the product, but you don't want to watch a long video for it? I understand. Attention spans have reduced in the age of the internet.
This 341 paged PDF tutorial contains all the things that as possible with this product. There are image screenshots of each steps for extra clarity.
Python add-on automation:
 There is a python script included in the product. The PDF and video tutorial will explain to you how to install it.
The python script automates many tasks which are usually manually done in blender.
Such as setting Output Format, Render engine, Path location and Aspect Ratio. Buttons for Rendering image and animation.
Apart from this, there are tabs for each individual Graphs to change Frame rates. Circle Graph and Pie Graph have support for Duration control and adding excess seconds at the end.
30 Day Refund Guarantee:
Blendermarket mandates all of its product to have a refund guarantee of 30 days with no questions asked.
Before buying, please first try the demo so that you can get a general idea of the product.
After buying, contact me via the support inbox or email me at jugaadanimation@gmail.com for any problem that you have.
Still, if you encounter any issue, then contact blendermarket for a refund.
Quick Support:

If you have any question whatsoever, or encounter any problem. Do contact me by the support inbox or at my email jugaadanimation@gmail.com
Multi-platform support (macOS, Linux, Windows):

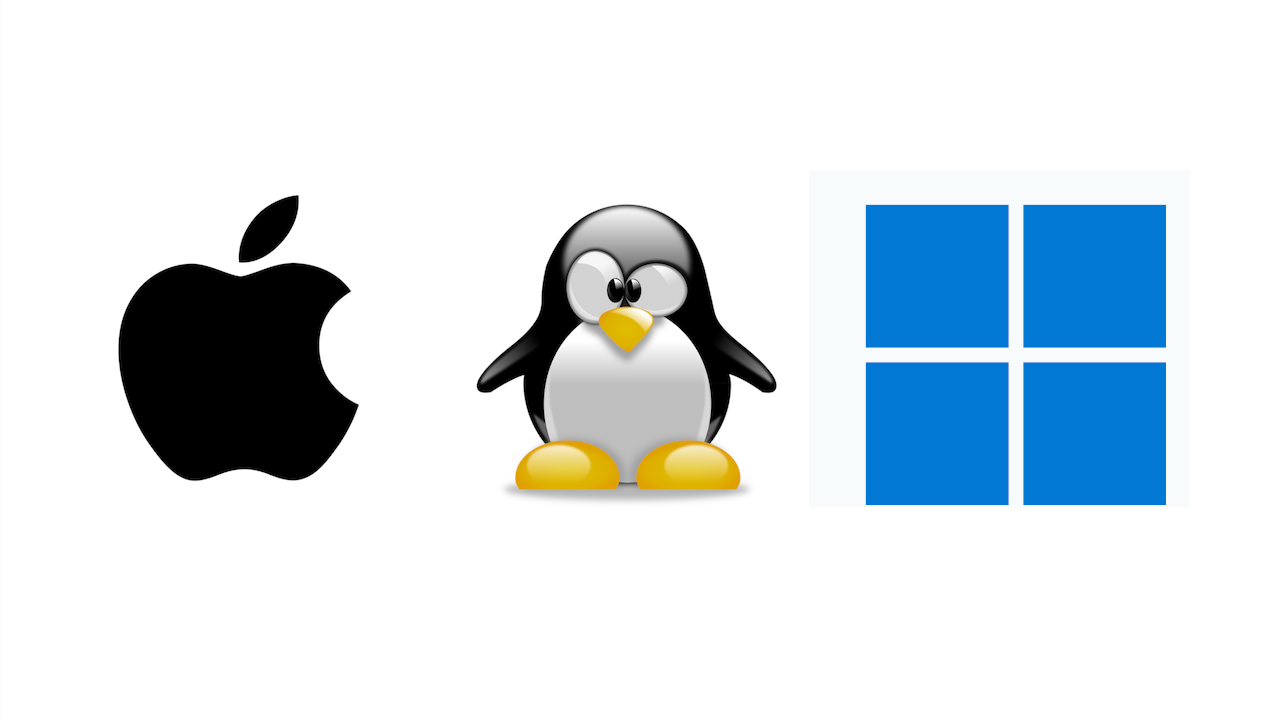
It works for macOS and Linux too.
Unlike After-Effects or Premiere-pro, Blender has native support for Linux. In fact, rendering is faster on Linux than on Windows. This product itself was made on Ubuntu.
THREE 4K Background Videos for Graphs:
Three background videos for the Graphs are available in 1080p and 4K resolution.
;The background videos are from Pexels and are licensed CC0, so you can use it for commercial and non-commercial purposes.
You can add your own background video too if you want. Just follow the tutorial.
All future updates are FREE:
Addition of Graphs and features in the future will be available for existing customers at no cost.
The price of this product may increase in the future. So, if you buy now, you will get new graphs and features at no extra cost.
About me :
Hi, My name is Vikrant Jadhav and I run a YouTube channel and a blendermarket page called Blender Renaissance.
My previous product “25 Professional Titles for Blender” has sold 103 copies on blendermarket.

I am a Motion Graphics freelancer and I have been using blender professionally for over 10 years.
I have done freelance jobs (like Explainer videos and App commercials) for various people in Spain, New Zealand, US, and India.
In conclusion:
I have tried everything to make sure the graphs are easier to use, and render. I also made sure that maximum freedom is allocated to the user.
This is the product I wish I had when I started working on it.
I hope it helps you the same way it would have helped me.
Thanking you,
-Vikrant Jadhav
Blender Renaissance
Discover more products like this
blender animation graph info graphs Pie Chart Multiple-circle-graph Multiple-pie-graph geometrynodes Bar-graph Circle Chart animated-geometrynode geometry nodes callout blender procedural Line-graph call-out titles Bar chart blender motion graphics geometry nodes blender flags charts title Line Chart Circle-graph animated titles color charts infographs infochart Pie-graph


